This Data Portfolio is designed to show you the work I have completed in my Information Architecture for Publishing and Database Publishing class at RIT.
Information Architecture for Publishing
Information Architecture (IA) is all about organizing information for both finding and understanding. This involves researching how users interact with your content and ensuring that IA processes are implemented that promote efficient "finding" and "understanding". The requisite competencies for information architecture including managing and accessing databases, researching user experiences, and applying schema or structure to information storage. Topics include best practices for content management, document structures, and cross-media deployment. Projects include XML tagging, UX research, Regular Expression usage, Digital Asset Management (DAM), navigation development, and data visualization.
Database Publishing
Database publishing is all about personalized graphic communications: this entails customizing graphic messaging for individuals and specifically targeted audiences. The requisite competencies for database publishing, including managing and accessing databases and integrating digital assets for distribution using electronic and digitally-printed methods, form the core of this course. Learners work with the fundamental design elements of databases constructed for activities that support graphic communication processes. Topics include best practices for building, optimizing, and maintaining databases comprised of recipient information and the merging of data with managed digital assets. Projects include composing publications and creating personalized documents for distribution through the web and in print.
Information Architecture for Publishing
-
Information Architecture and Paragraph Styles
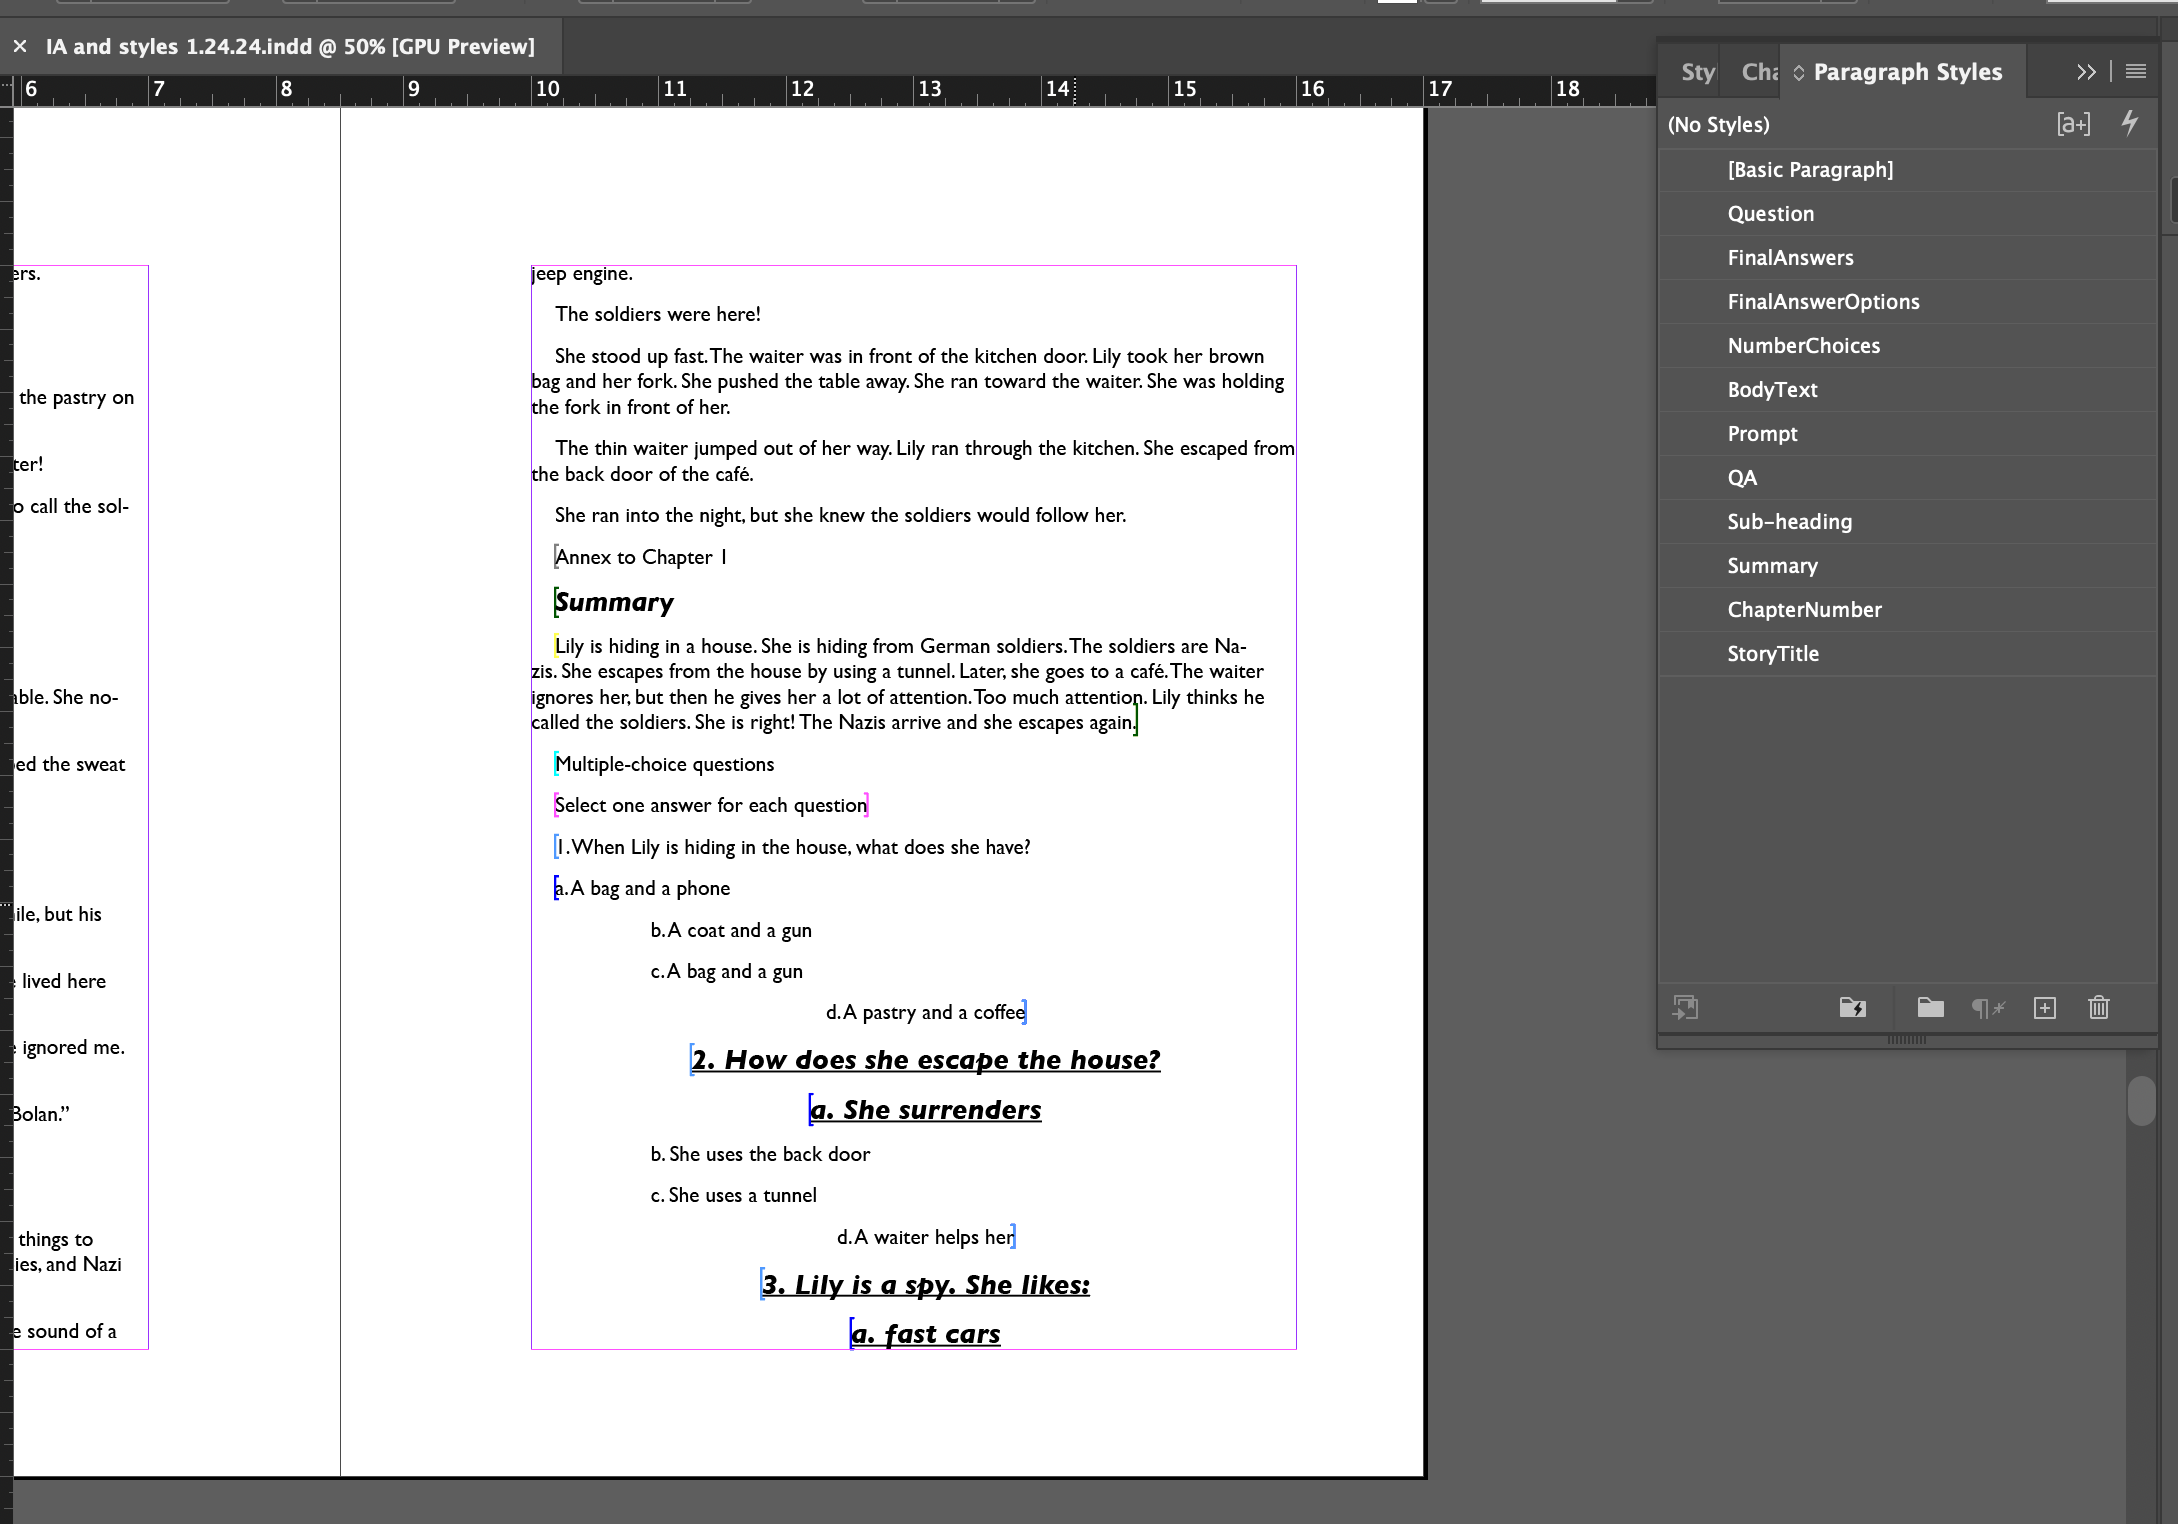
Understanding document structure and organization principles
Practical application of Adobe InDesign for publishing tasks
Creation and implementation of paragraph styles for consistent formatting
Importance of tagging elements for metadata and information retrieval
Demonstrating effective Information Architecture practices for publishing workflows
-
REGEX and XML/JSON markup for DATA
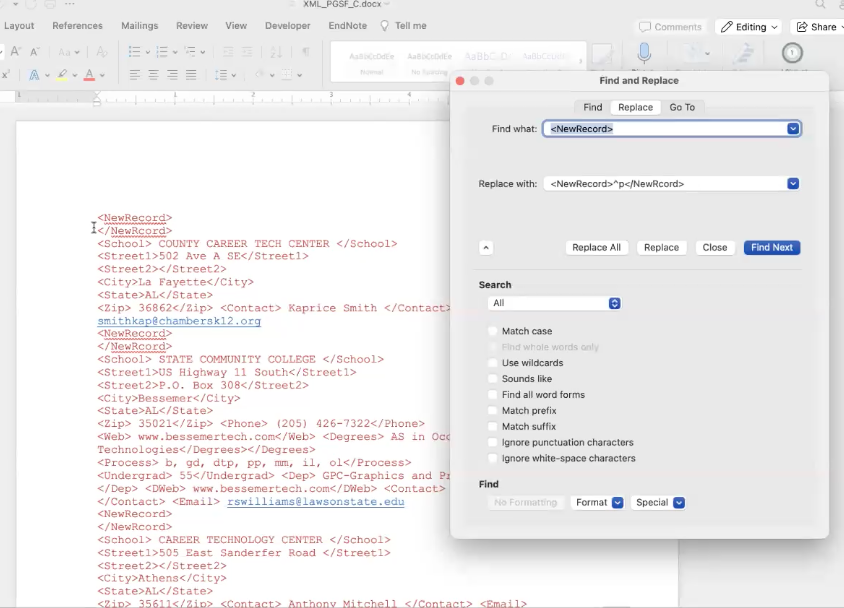
Extracted semi-structured data from the PGSF Directory of Graphic Communications schools
Utilized XML markup to organize and structure fields within the data for dataset creation
Demonstrated understanding of regular expressions (REGEX) and their application in querying data patterns
Leveraged Microsoft Word's wildcard tool to format XML data from the published directory
Applied REGEX to efficiently mine and format data, showcasing its usefulness in data manipulation and organization
-
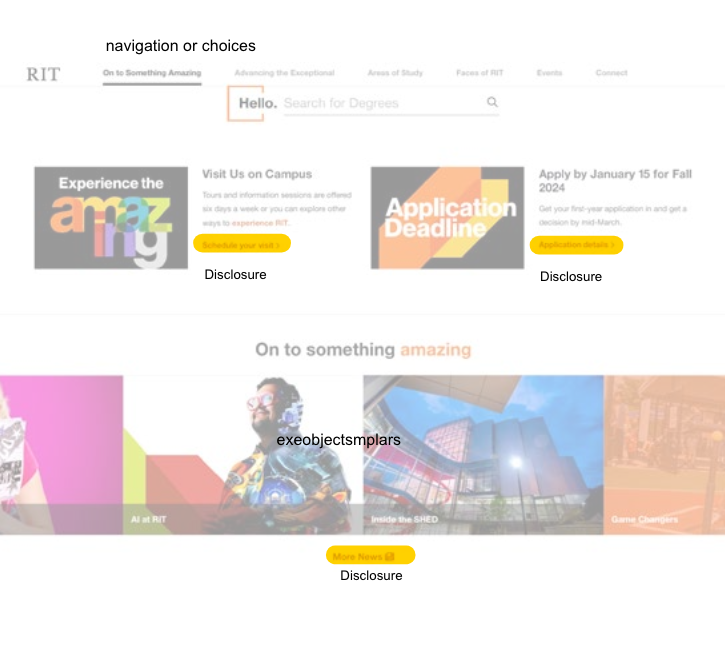
RIT Website IA
Explored the RIT website to identify content organization and user navigation strategies
Employed Adobe Acrobat Pro to mark up the PDF directly
Identified and applied the 8 Principles of IA:
Objects
Choices
Disclosure
Exemplars
Front Doors
Multiple Classification
Focused Navigation
Growth
-

Card Sorting Study
Initiated a card sort study using Optimal Workshop
Selected a topic with variability in organization: emotions
Compiled a list of 40 different emotions for users to categorize
Chose an open research model
Limited categorization options to 4-8 categories to maintain complexity and variability
Implemented card sorting to understand how users mentally organize and categorize emotions
Utilized card sorting results to inform the information architecture of the site, ensuring it resonates with the audience's mental models and preferences.
-
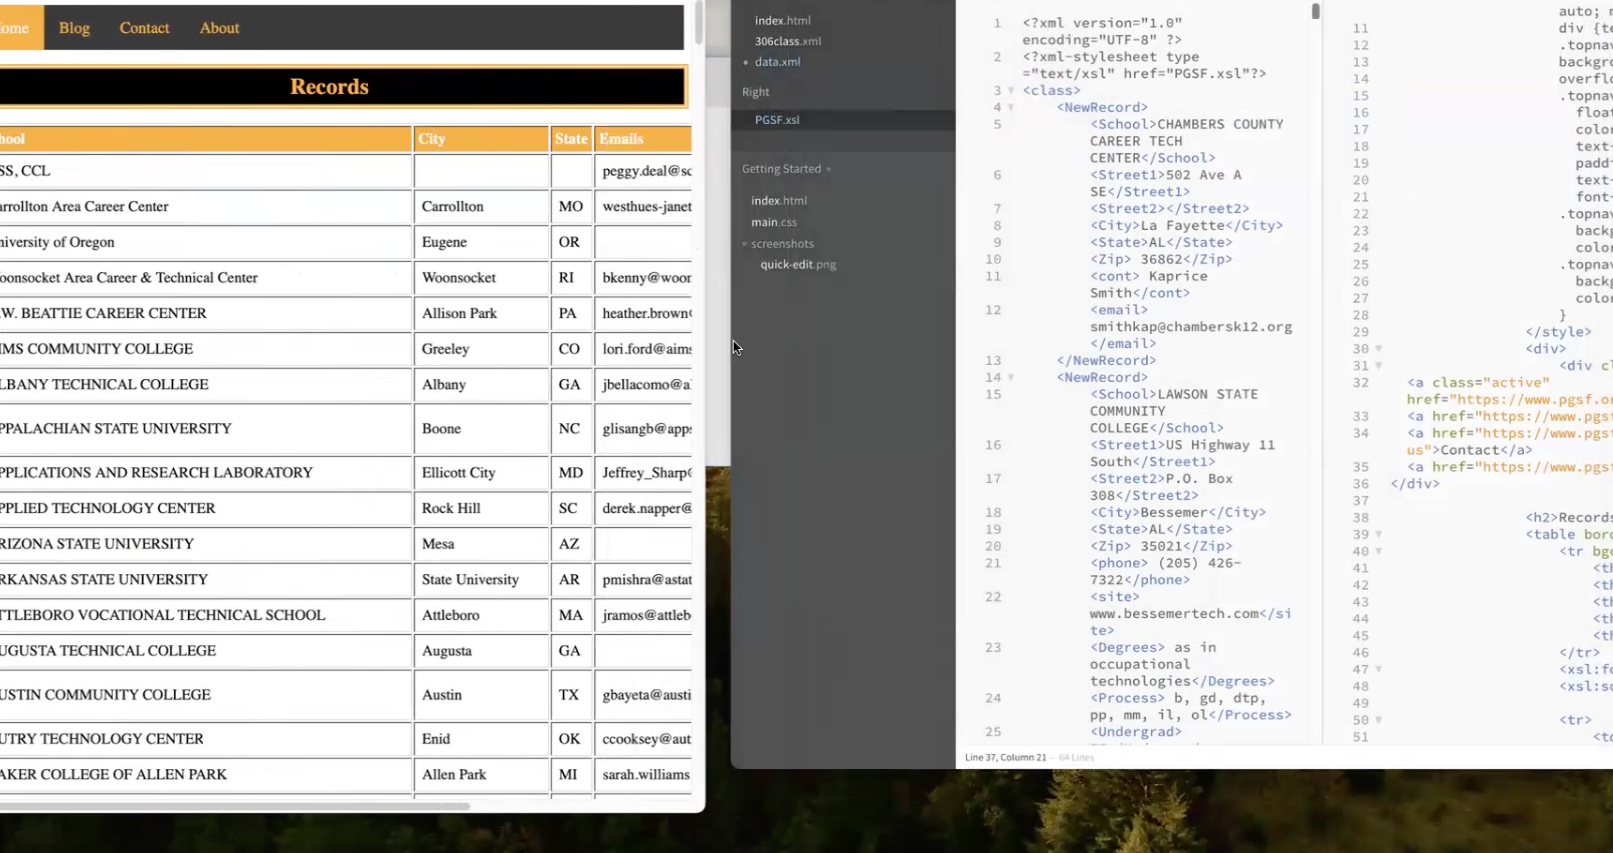
XML & XSL
Created XML records with attributes to encapsulate specific data related to elements.
Implemented XSLT to transform XML documents into HTML, enabling dynamic content display.
Utilized XPath to efficiently locate and extract information within XML documents.
Designed a website displaying XML data in a table format, integrating HTML, CSS, and JavaScript for content, layout, and behavior.
Demonstrated XML's flexibility across different media and the power of XSLT in manipulating XML data for presentation.
-

XSL and OpenRefine Templating
Applied XSL and OpenRefine templating techniques to manipulate PGMT student data extracted from an XLSX file.
Utilized OpenRefine's functionality to clean messy data, ensuring accuracy and consistency.
Employed OpenRefine for transforming data between different formats, facilitating seamless integration with other systems.
-

AID XSL for Indesign Import
XSL file that allows XML data to be imported into tables in Indesign
Utilized AID (Adobe InDesign) and XSL (eXtensible Stylesheet Language) for importing XML data into InDesign documents.
Created XML files containing structured data suitable for publication.
Developed XSL stylesheets to transform XML data into a format compatible with InDesign's import functionality.
Demonstrated proficiency in leveraging XML and XSL for efficient data import and publication in Adobe InDesign.
-
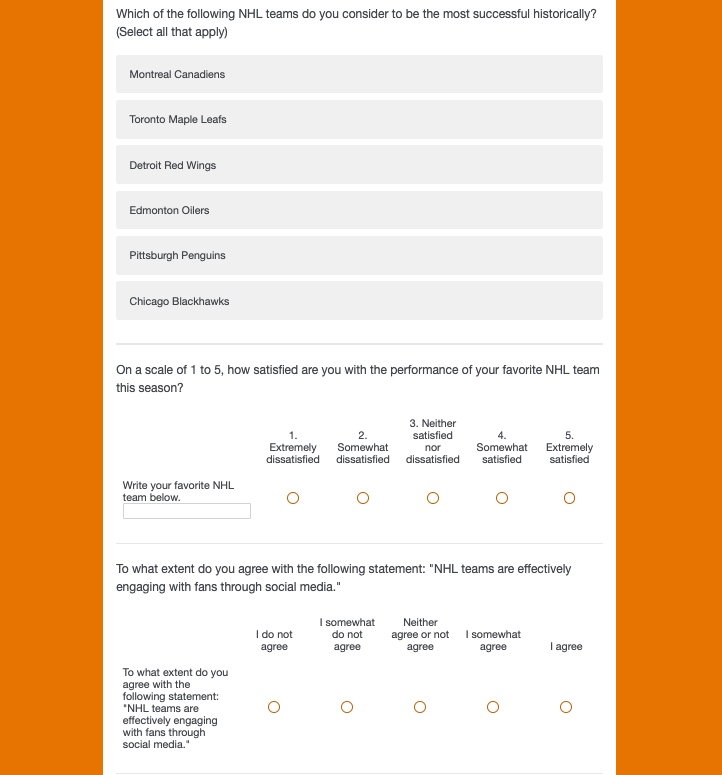
Survey Design
Designed a simple survey using Qualtrics for data collection on NHL preferences.
Implemented a flow control question for the multiple-choice (multiple answer) question type.
Directed respondents to one of the Likert scale questions based on their selection in the flow control question.
Asked personalized questions to gather data tailored to individual preferences in the NHL domain.
Demonstrated proficiency in survey design and flow control functionality within Qualtrics for personalized data collection.
-

Data Mining and REGEX using Python
Python Basics:
Learned about Python libraries and importing specific classes from them.
Practiced defining variables and functions in Python.
Demonstrated the ability to call functions and pass variables as arguments.
Regular Expression (REGEX):
Explored various REGEX concepts including character classes, shorthand character classes, assertions, word boundaries, and positive lookahead.
Applied REGEX through practical exercises and applications.
Data Mining:
Understood the relevance of Information Architecture (IA) principles in applying workflow tools for efficient website data mining.
Utilized AI tools to assist in coding tasks, enhancing productivity and accuracy.
-
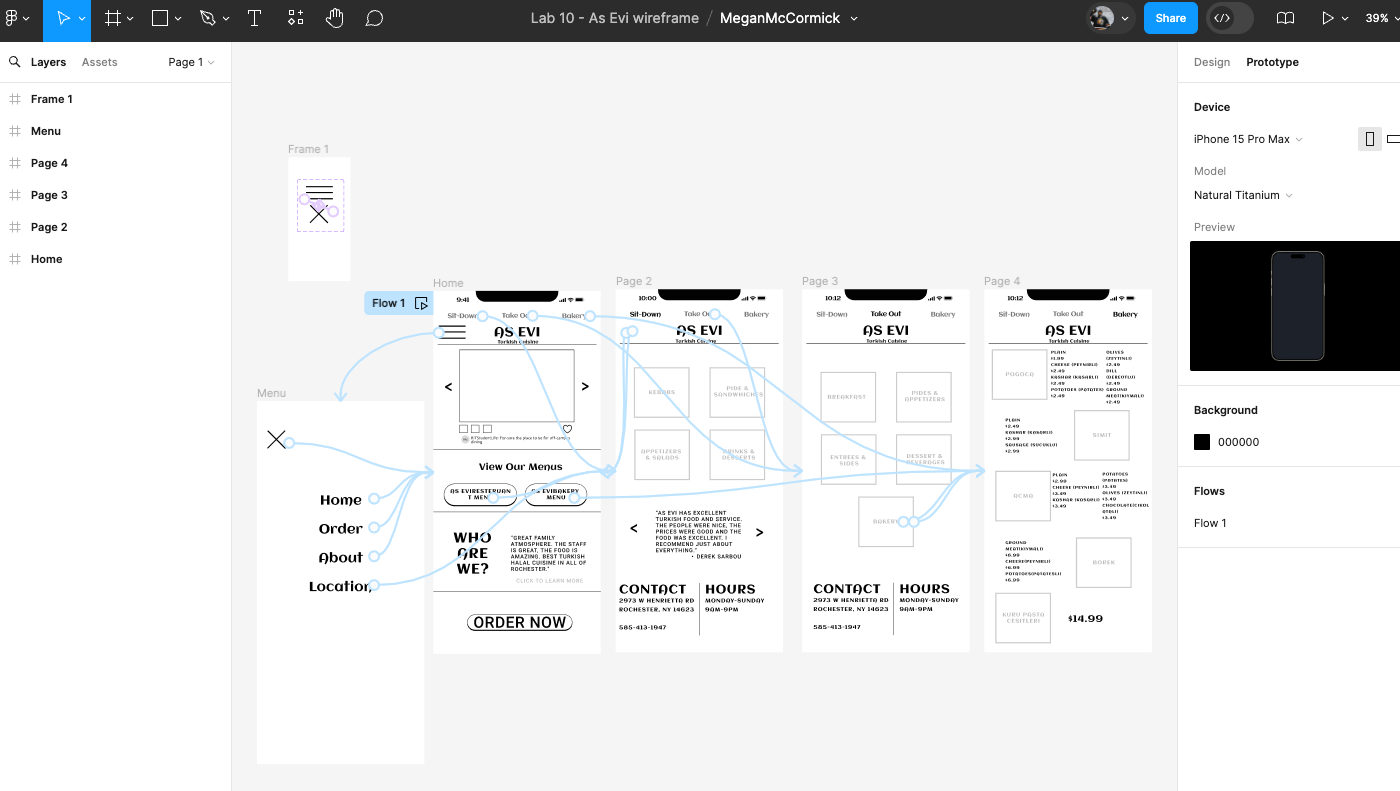
Low-Fidelity Wire Framing using Figma
Used Figma to create low-fidelity wireframes for a mobile app project.
Designed 5 screens including Home and three services with emphasis on layout and navigation.
Incorporated header and footer elements for comprehensive navigation within the app.
Linked screens to demonstrate app flow and utilized libraries for efficient wireframing.
-
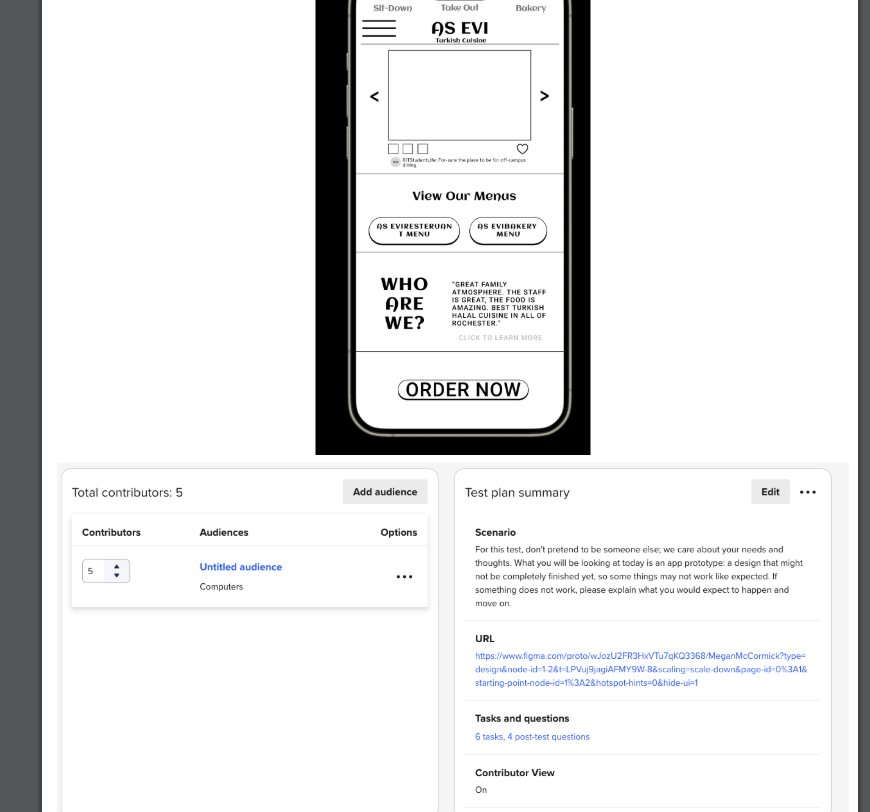
Usertesting Prototype
Developed a usability test in Usertesting based on the Prototyping template.
Crafted 4 to 5 questions to assess user experience with the Figma wireframe.
Incorporated questions aimed at evaluating user interaction, navigation, and comprehension of the wireframe design.
Designed the test to gather valuable feedback and insights for iterative improvement of the wireframe prototype.
-

Icon Development
Engaged in icon development during Lab 12, utilizing Adobe Illustrator for sketching.
Created sketches of icons to be used in various design projects or applications.
Demonstrated proficiency in Adobe Illustrator for creating vector-based icons.
Acquired skills in conceptualizing and sketching icons for use in digital or print media.
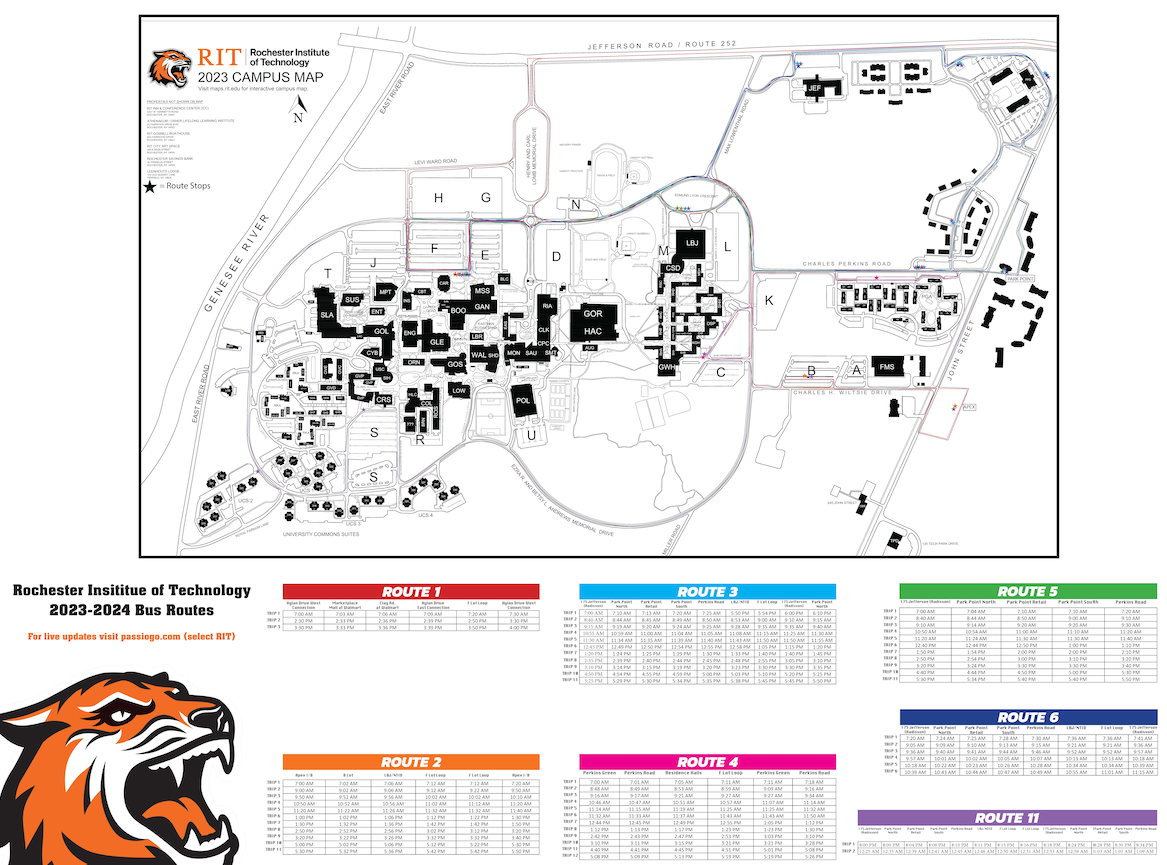
This final project involves creating a comprehensive transportation guide for RIT Buses, encompassing both web and print components. The project begins with tagging GTFS data with XML tags to be used across all deliverables. A wide-format poster (36'x48') displaying all RIT bus routes on a single page was produced using XML data imported into InDesign, with the option to utilize XSLT for transformation.
Database Publishing
-
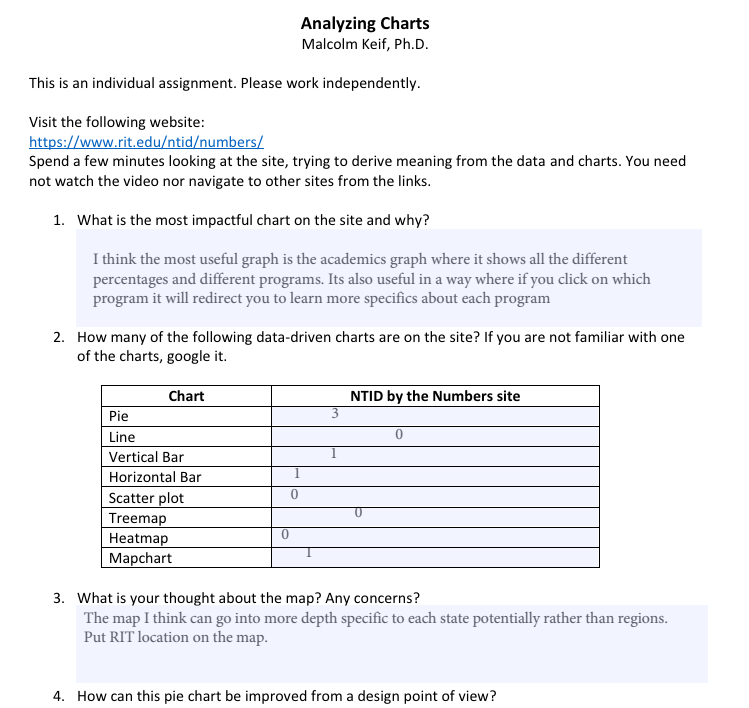
Analyzing Charts
Independently analyzed the NTID by the Numbers website.
Identified the most impactful chart on the site and provided reasoning.
Recognized various data-driven charts present on the site, including pie, line, vertical bar, horizontal bar, scatter plot, treemap, heatmap, and mapchart.
Offered thoughts and concerns regarding the displayed map on the site.
Provided suggestions for improving a specific pie chart from a design perspective.
Recalled details about each section of the site, including Enrollment, Academics, Access Services, and Employment/Earnings, without revisiting the site, describing the data and visuals included in each section.Practical application of Adobe InDesign for publishing tasks
Creation and implementation of paragraph styles for consistent formatting
Importance of tagging elements for metadata and information retrieval
Demonstrating effective Information Architecture practices for publishing workflows
-
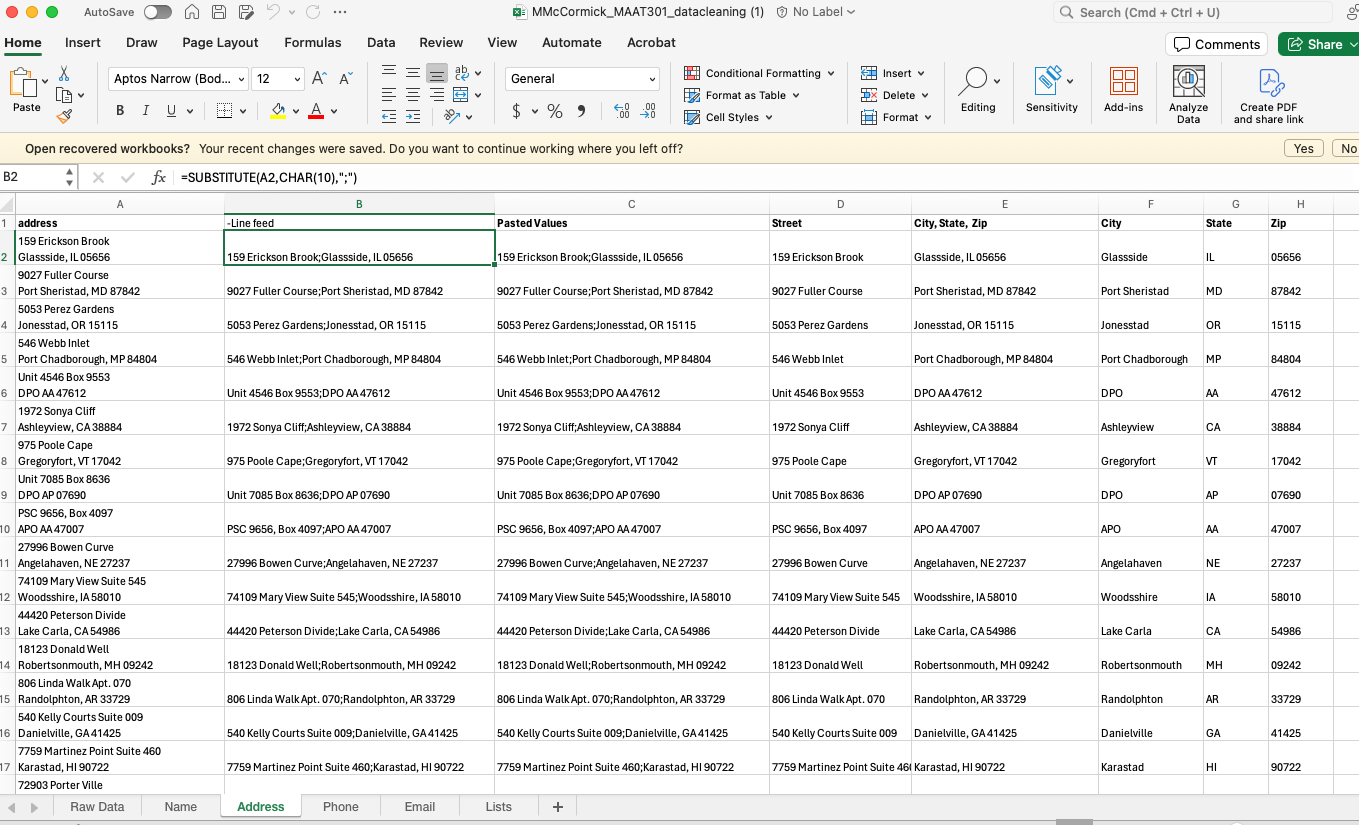
Data Cleaning
Utilized fake data sets to practice organizing and cleaning data.
Learned the basics of Excel functions and features for data manipulation.
Categorized data into separate categories to enhance readability and analysis.
Gained proficiency in organizing and formatting data for improved clarity and interpretation.
-
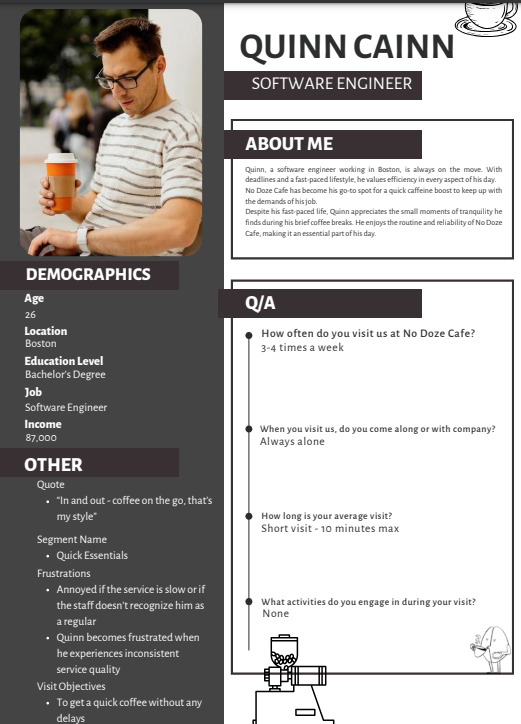
Segmentation and Creating Personas
Analyzed data from a small coffee shop in Boston to identify two or more market segments.
Identified patterns in customer behaviors by analyzing visit frequency, companionship, visit duration, and activities during visits.
Explored how direct mail marketing campaigns targeted at specific segments could increase customer loyalty, satisfaction, and sales.
Created personas representing different market segments based on demographics, visit objectives, habits, frustrations, and other relevant factors.
Selected photos and names for each persona to represent their characteristics and preferences.
Crafted quotes summarizing each persona's perspective on their coffee shop experience.
Developed descriptive names for each segment represented by the personas.
Designed professional and attractive one-page documents for each persona, including relevant graphics and descriptions.
-

Data Mining
Conducted a Consumer/lifestyle search on ReferenceUSA for home zip code to gather data on estimated home income.
Conducted a job/internship search for Media Arts in home zip code and expanded search radius if needed.
Conducted a US Business search for Data Processing Service NAICS code and closest major city to home, downloaded Detailed .CSV file if under 250 records, otherwise filtered further.
Explored accuracy of White Pages search for self and parent/close friend.
Utilized Google Dataset Search to search for Winter Olympics and found Beijing 2022 Winter Game.
Explored dataset on Revenues and Costs of Olympic Games from Harvard site, examined its content and possible applications.
Searched for a list of licensed Realtors in NYC for a personalized direct mailing marketing campaign, noted the number of records found and included data.
-
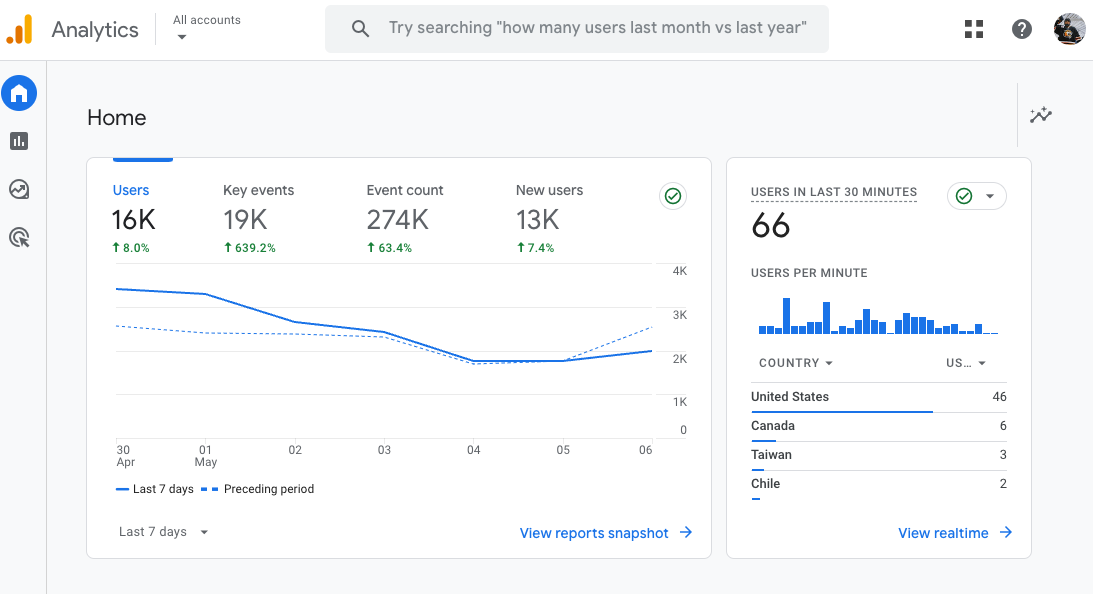
Google Analytics
Explored various views including HOME, REPORTS, EXPLORE, and ADVERTISING in the GA4 Analytics interface.
Analyzed data for the time period from Jan 1, 2023, to Jan 31, 2023.
Identified the date with the fewest visits, the country with the second most users, and the number of users from that country.
Determined the total number of items purchased and the item revenue for specific products during the time period.
Compared data between two different time periods (Jan 5-11, 2023, and the prior week) to analyze changes in event count, revenue, page views, and user medium.
Calculated the percentage increase in event count and total revenue between the two time periods.
Identified the top pages viewed and the user medium driving the most session traffic to the store on specific dates.
Analyzed the effectiveness of Google Ad Campaigns by identifying the campaign driving the most ad clicks to the store on a specific date.
-

Mail Merge & Data Merge
Utilized Excel to clean and prepare data for mail merge, including generating future data such as upcoming birthdays or days away from birthdays.
Used Adobe InDesign to import cleaned data and create personalized postcards for mailing.Demonstrated the ability to personalize postcards by incorporating data inputs, such as recipient names and upcoming birthdays.
Showcased proficiency in leveraging Excel for data manipulation and InDesign for creating personalized marketing materials.
-
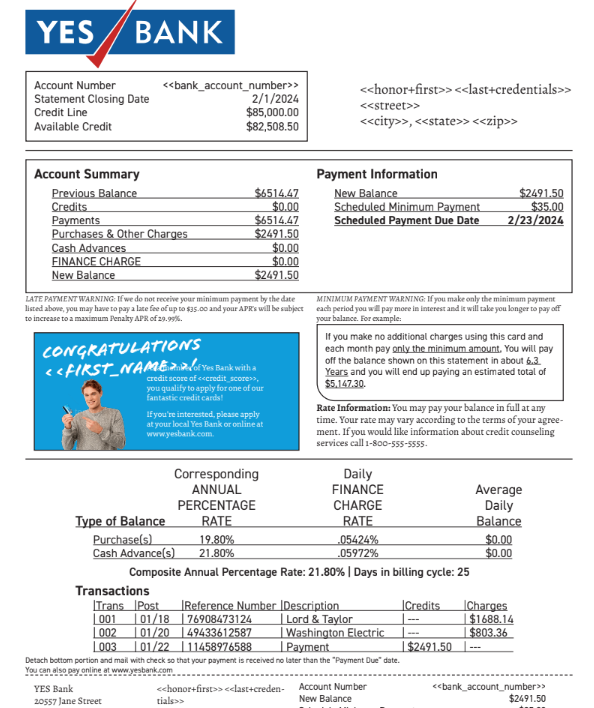
2024 Xplor Communication Design Competition
Participation in the Xplor International Communication Design Competition.
Involvement in a team-based project focused on redesigning statements for improved functionality and aesthetics.
Engagement in the entire process, from receiving the bill to be redesigned to making presentations to faculty advisors.
Highlighting collaboration skills, creativity, and problem-solving abilities demonstrated throughout the competition.
Demonstrating an understanding of the importance of effective customer communications in driving business outcomes.
-

ERD Problems
Designing a database for storing "To do" lists for users, including basic contact details like address, email, and mobile number.
Incorporating a feature to input users' unique tasks (to do list) and a checkbox for marking completed items.
Demonstrating proficiency in entity-relationship diagram (ERD) design and database modeling.
Highlighting problem-solving skills in designing databases to meet specific organizational needs.
Showcasing the ability to translate real-world scenarios into structured database schemas for effective data management.
-

CASPIO ERD problems
Building datasets using Caspio, a cloud-based platform for creating online database applications.
Designing an Entity-Relationship Diagram (ERD) within the Caspio program to visually represent the structure and relationships of the database tables.
Demonstrating proficiency in using Caspio's interface to define tables, fields, and relationships between entities.
Utilizing Caspio's features for creating forms, reports, and other database-driven components to enhance data management and accessibility.
Showcasing the ability to work with cloud-based tools for database development, highlighting adaptability to different platforms and technologies.
Emphasizing problem-solving skills in translating data requirements into a functional database schema using Caspio's capabilities.
Illustrating effective data modeling techniques for organizing and managing complex datasets within a cloud-based environment.
-

Pivot Tables
Utilizing Excel to clean and organize survey data collected from PGMT students, ensuring accuracy and consistency for analysis.
Demonstrating proficiency in creating pivot tables within Excel to summarize and analyze large datasets efficiently.
Applying pivot table features such as grouping, filtering, and sorting to extract meaningful insights from the survey data.
Employing pivot table functionalities to generate visual representations of the data, including charts and graphs, to facilitate data interpretation.
Showcasing the ability to customize pivot tables to meet specific analytical requirements and present findings effectively.
Illustrating critical thinking skills in identifying trends, patterns, and correlations within the survey data through pivot table analysis.
Emphasizing the importance of data visualization and interpretation in informing decision-making processes based on survey results.
-
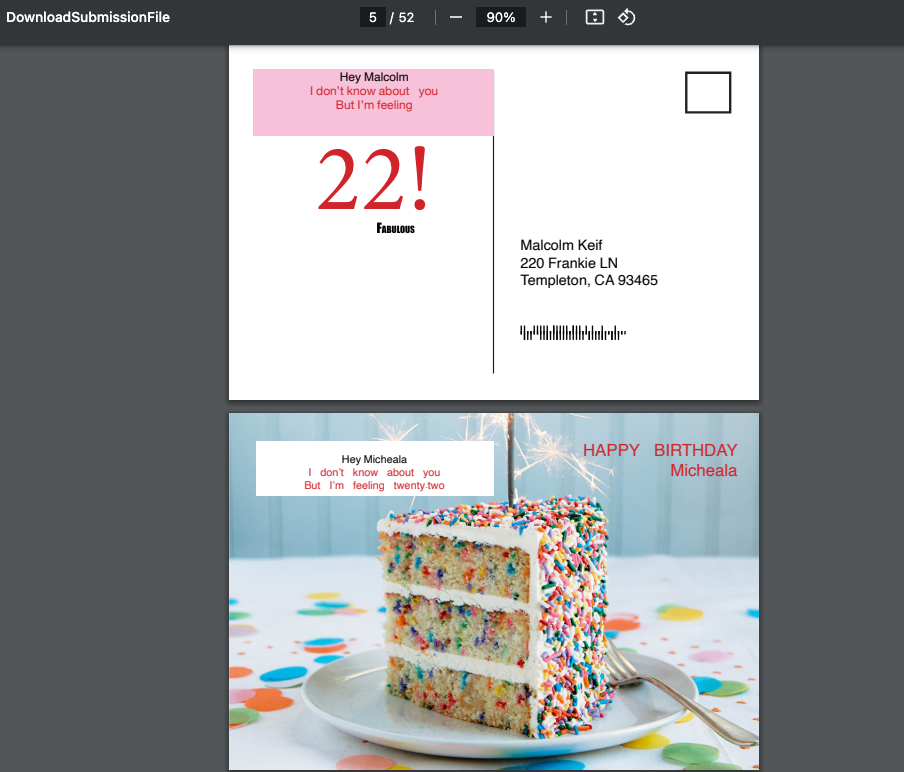
Fusion Pro Birthday Mailer
Learned Fusion Pro, a feature within Adobe Acrobat, for creating and tagging elements to enable personalization using datasets.
Explored the functionalities of Fusion Pro to dynamically generate personalized documents based on input data variables.
Implemented data tagging techniques to link dataset fields with corresponding elements in the document template, ensuring accurate personalization.
Demonstrated proficiency in Fusion Pro by creating personalized documents such as letters, invoices, or reports with dynamically populated content.
Highlighted the importance of Fusion Pro in streamlining document production processes and enhancing customer engagement through personalized communication.
Showcased the ability to leverage Fusion Pro to automate repetitive tasks and improve efficiency in document generation workflows.
Emphasized the role of Fusion Pro in creating customized and targeted communications tailored to individual recipients, thereby enhancing the overall user experience.
Final Project - Cross Media Marketing Campaign
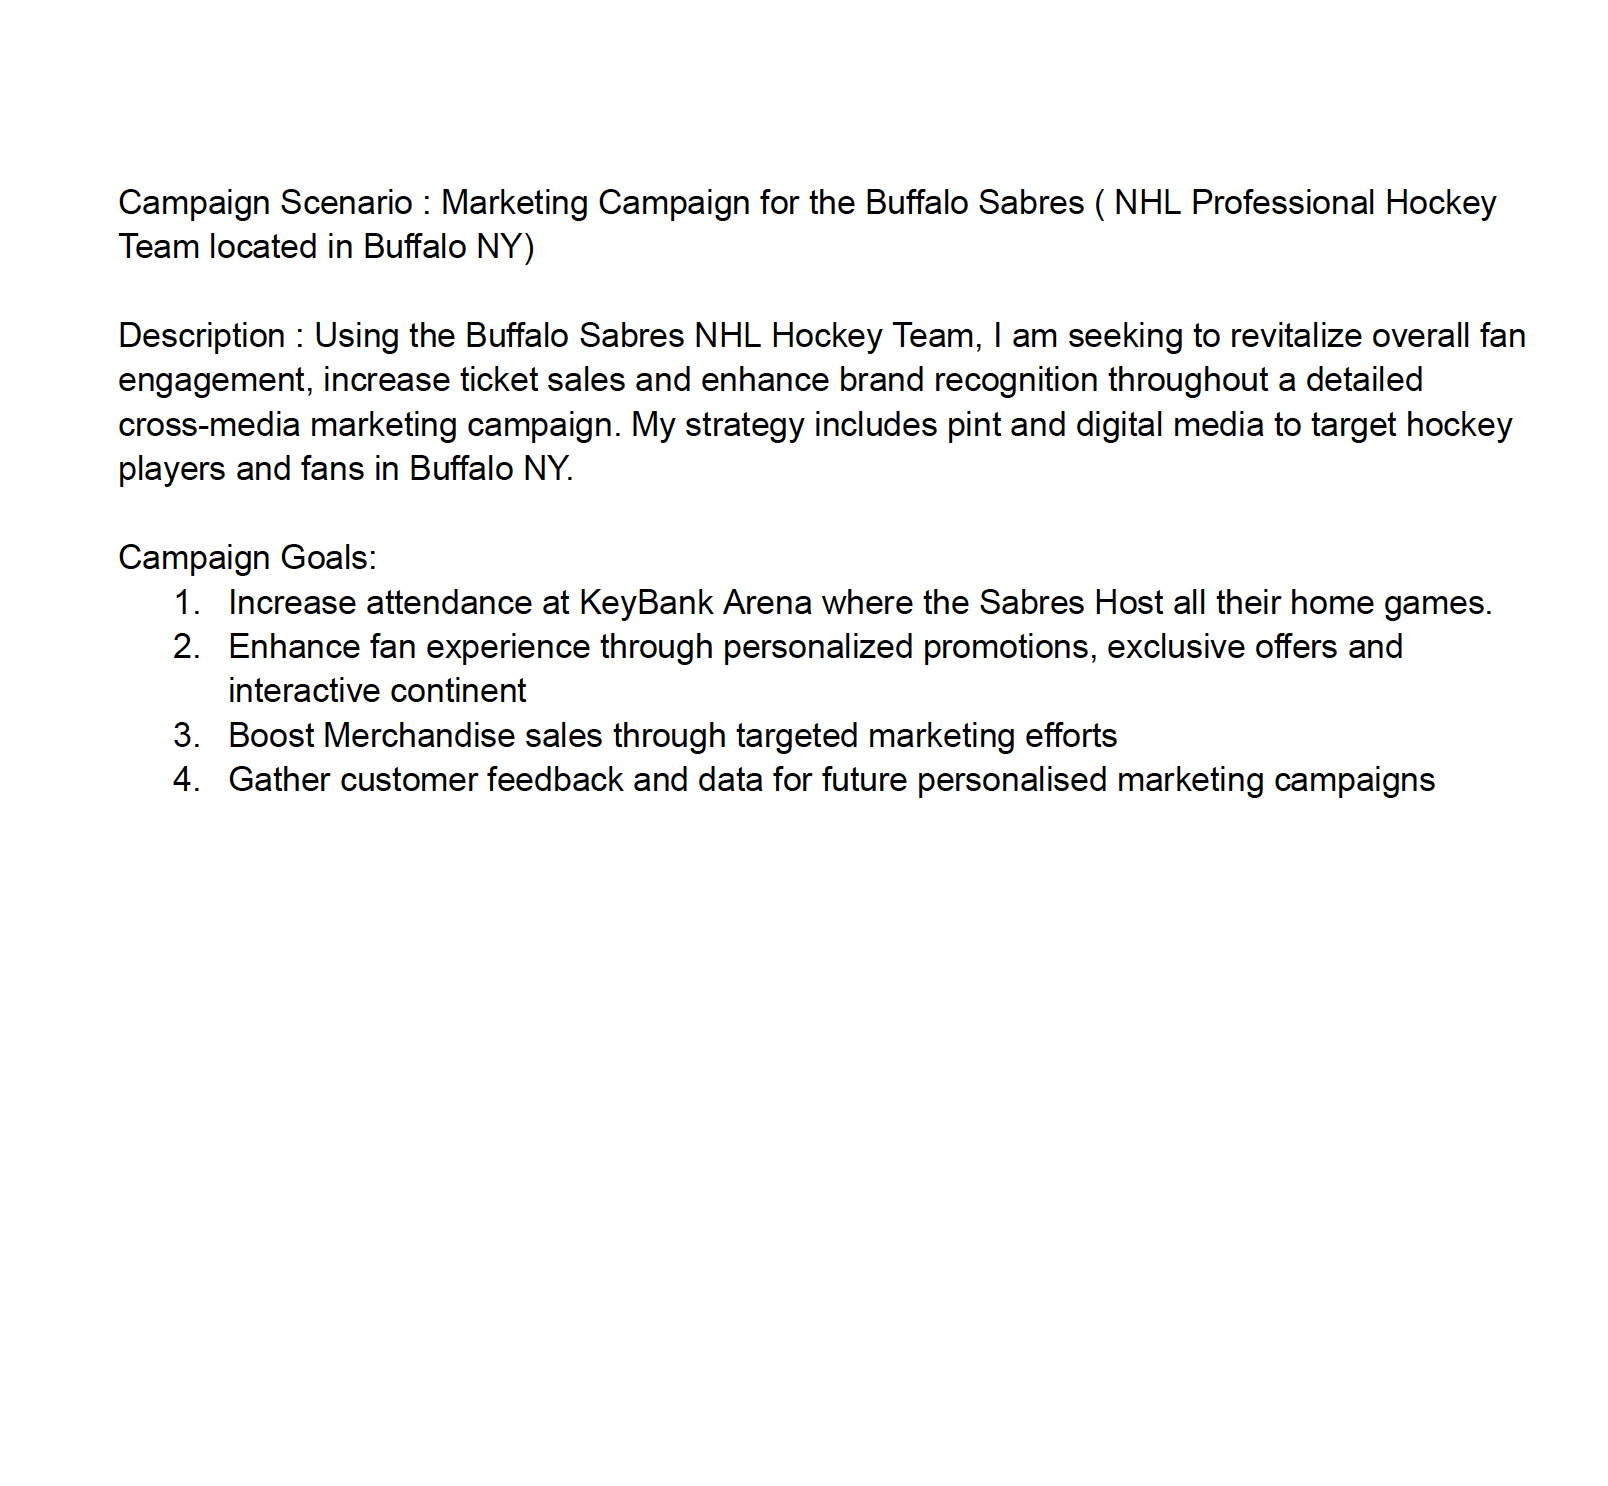
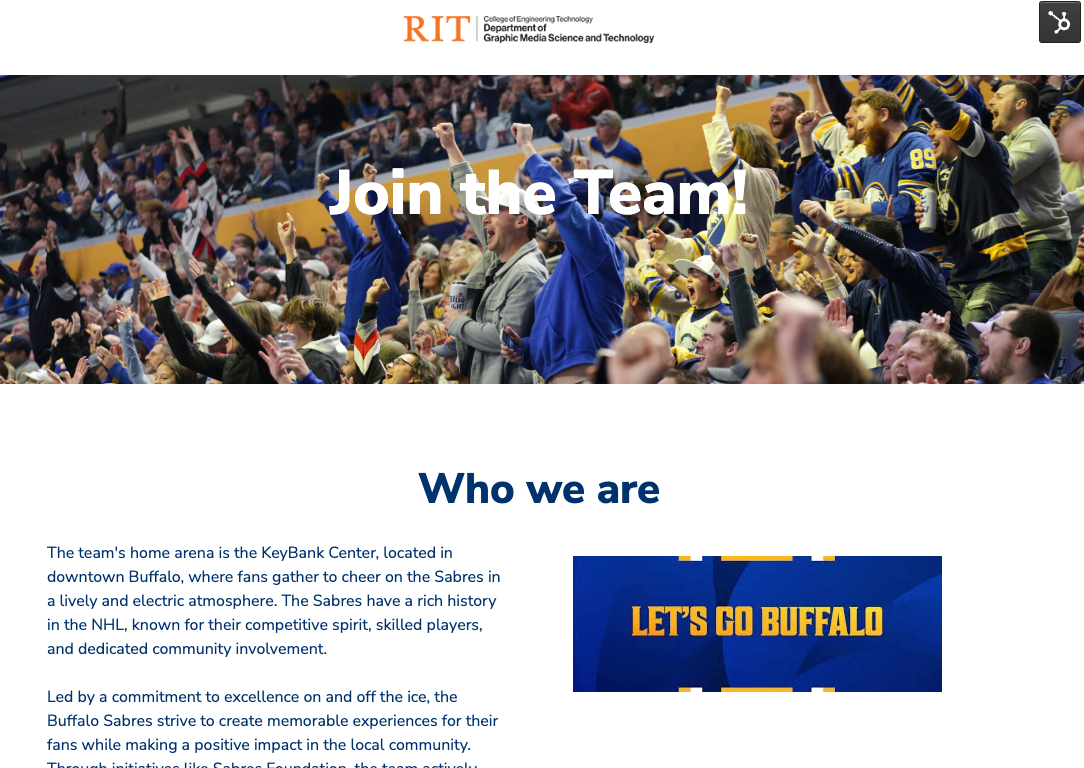
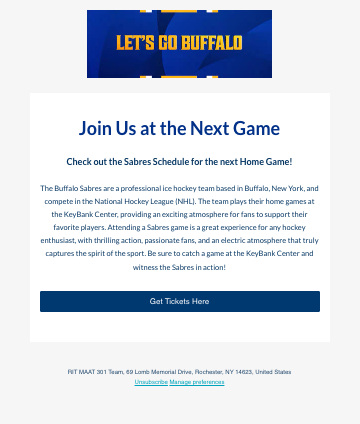
Developed a comprehensive cross-media, data-driven marketing campaign for the Buffalo Sabres hockey team.
Crafted a strategic campaign description outlining goals and objectives, ensuring alignment with organizational objectives.
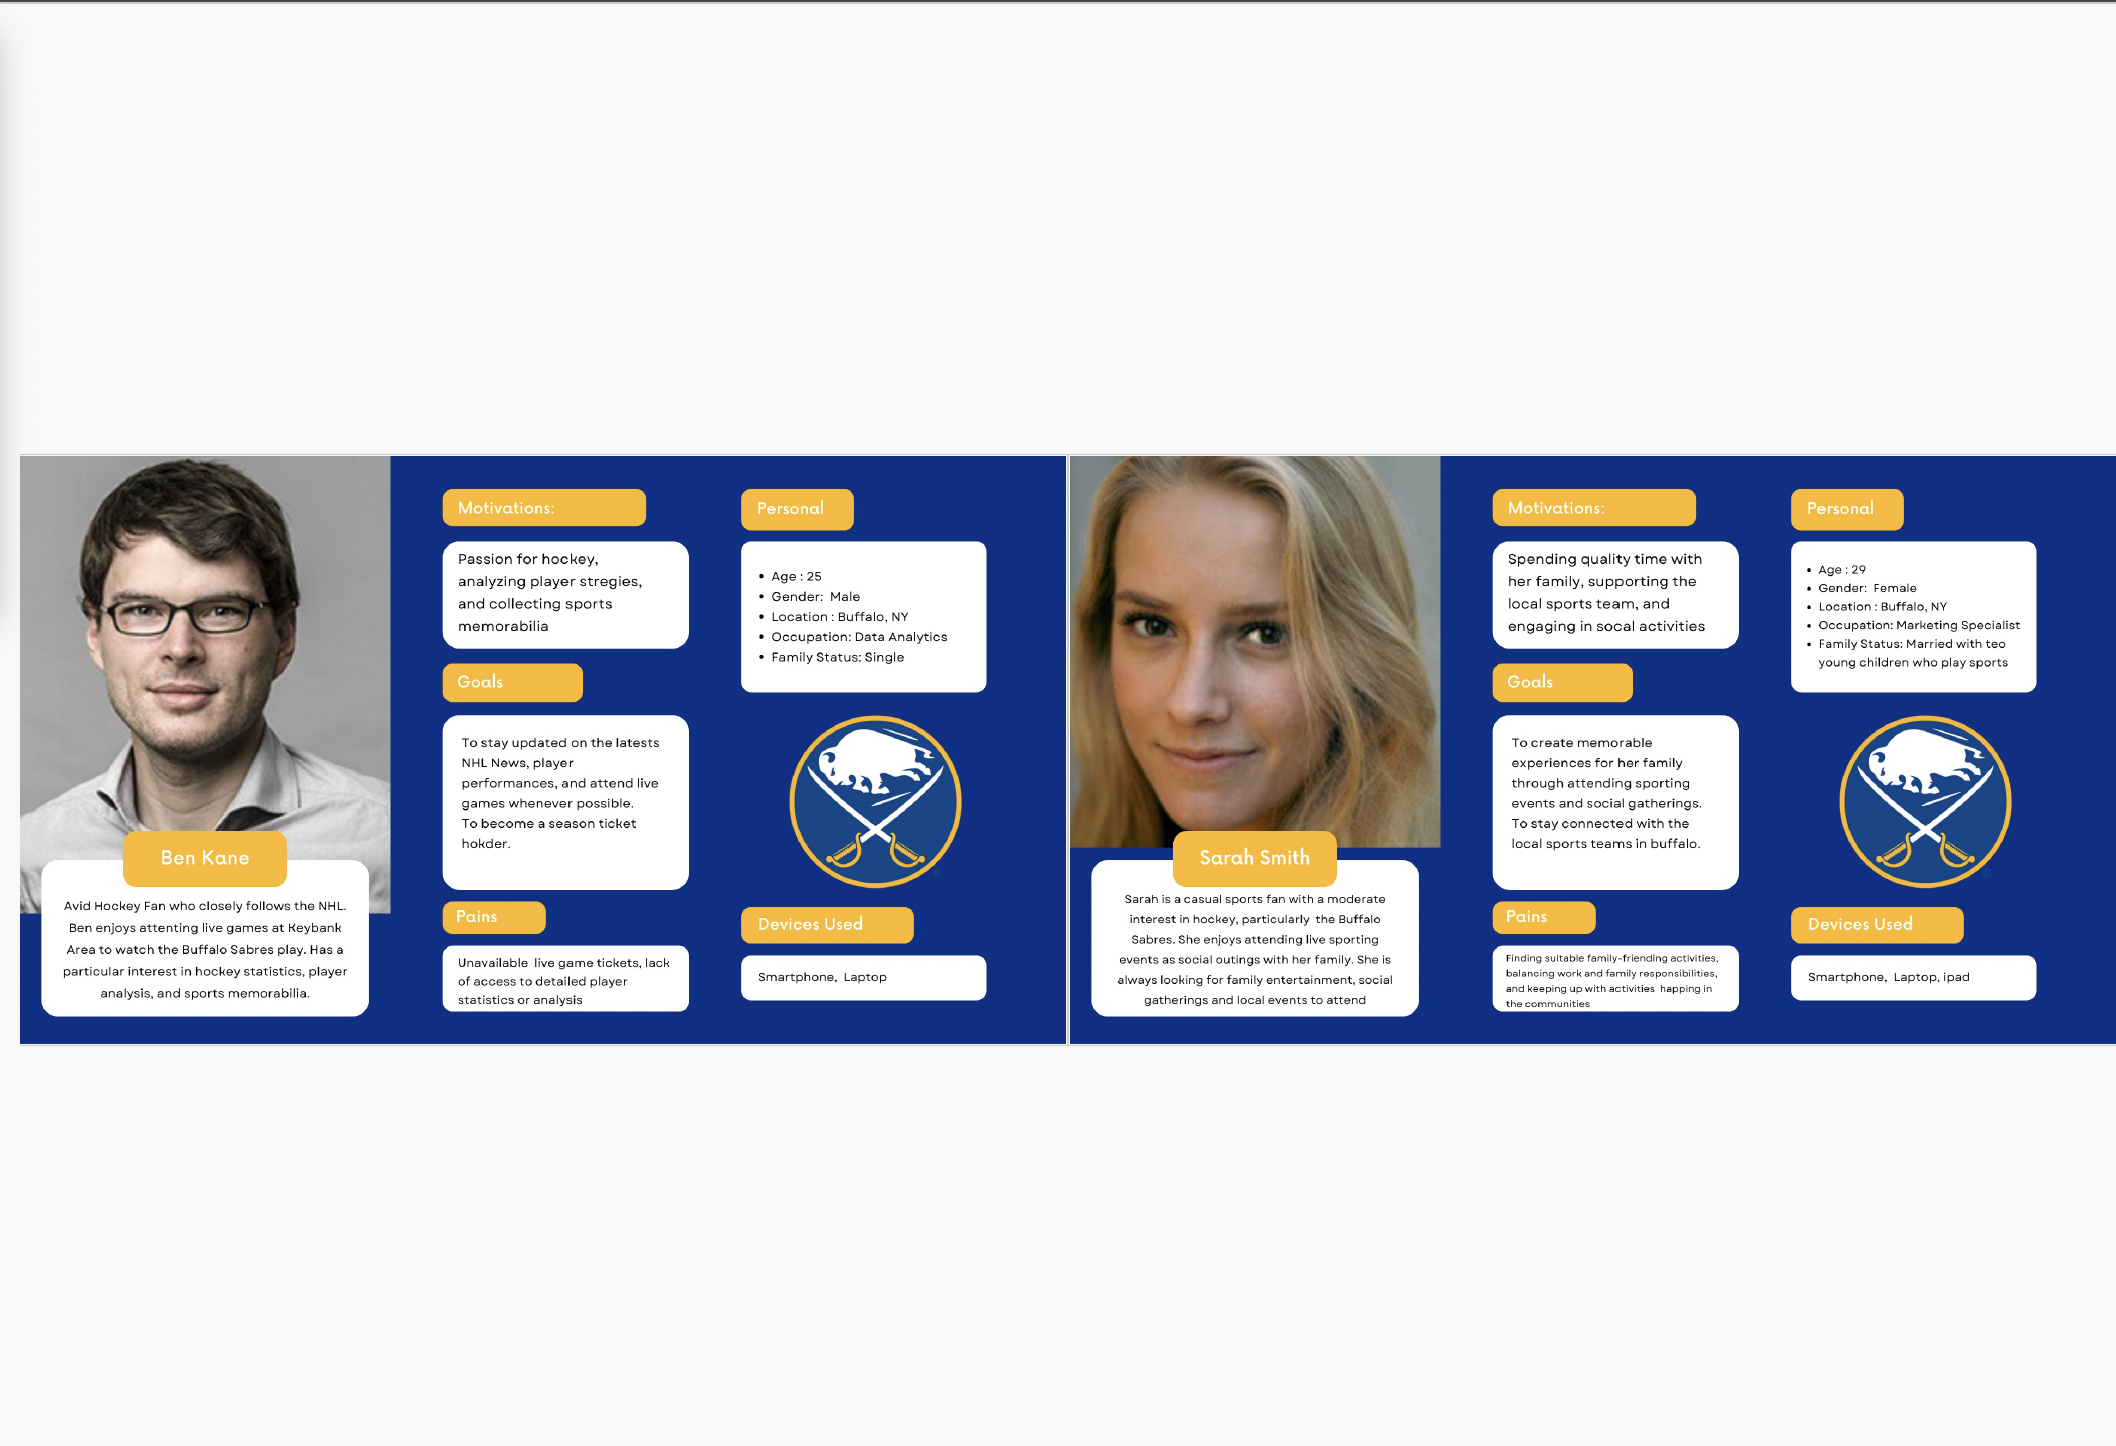
Created two or more detailed personas representing target market segments, focusing on demographic characteristics, interests, and data-driven segmentation approaches.
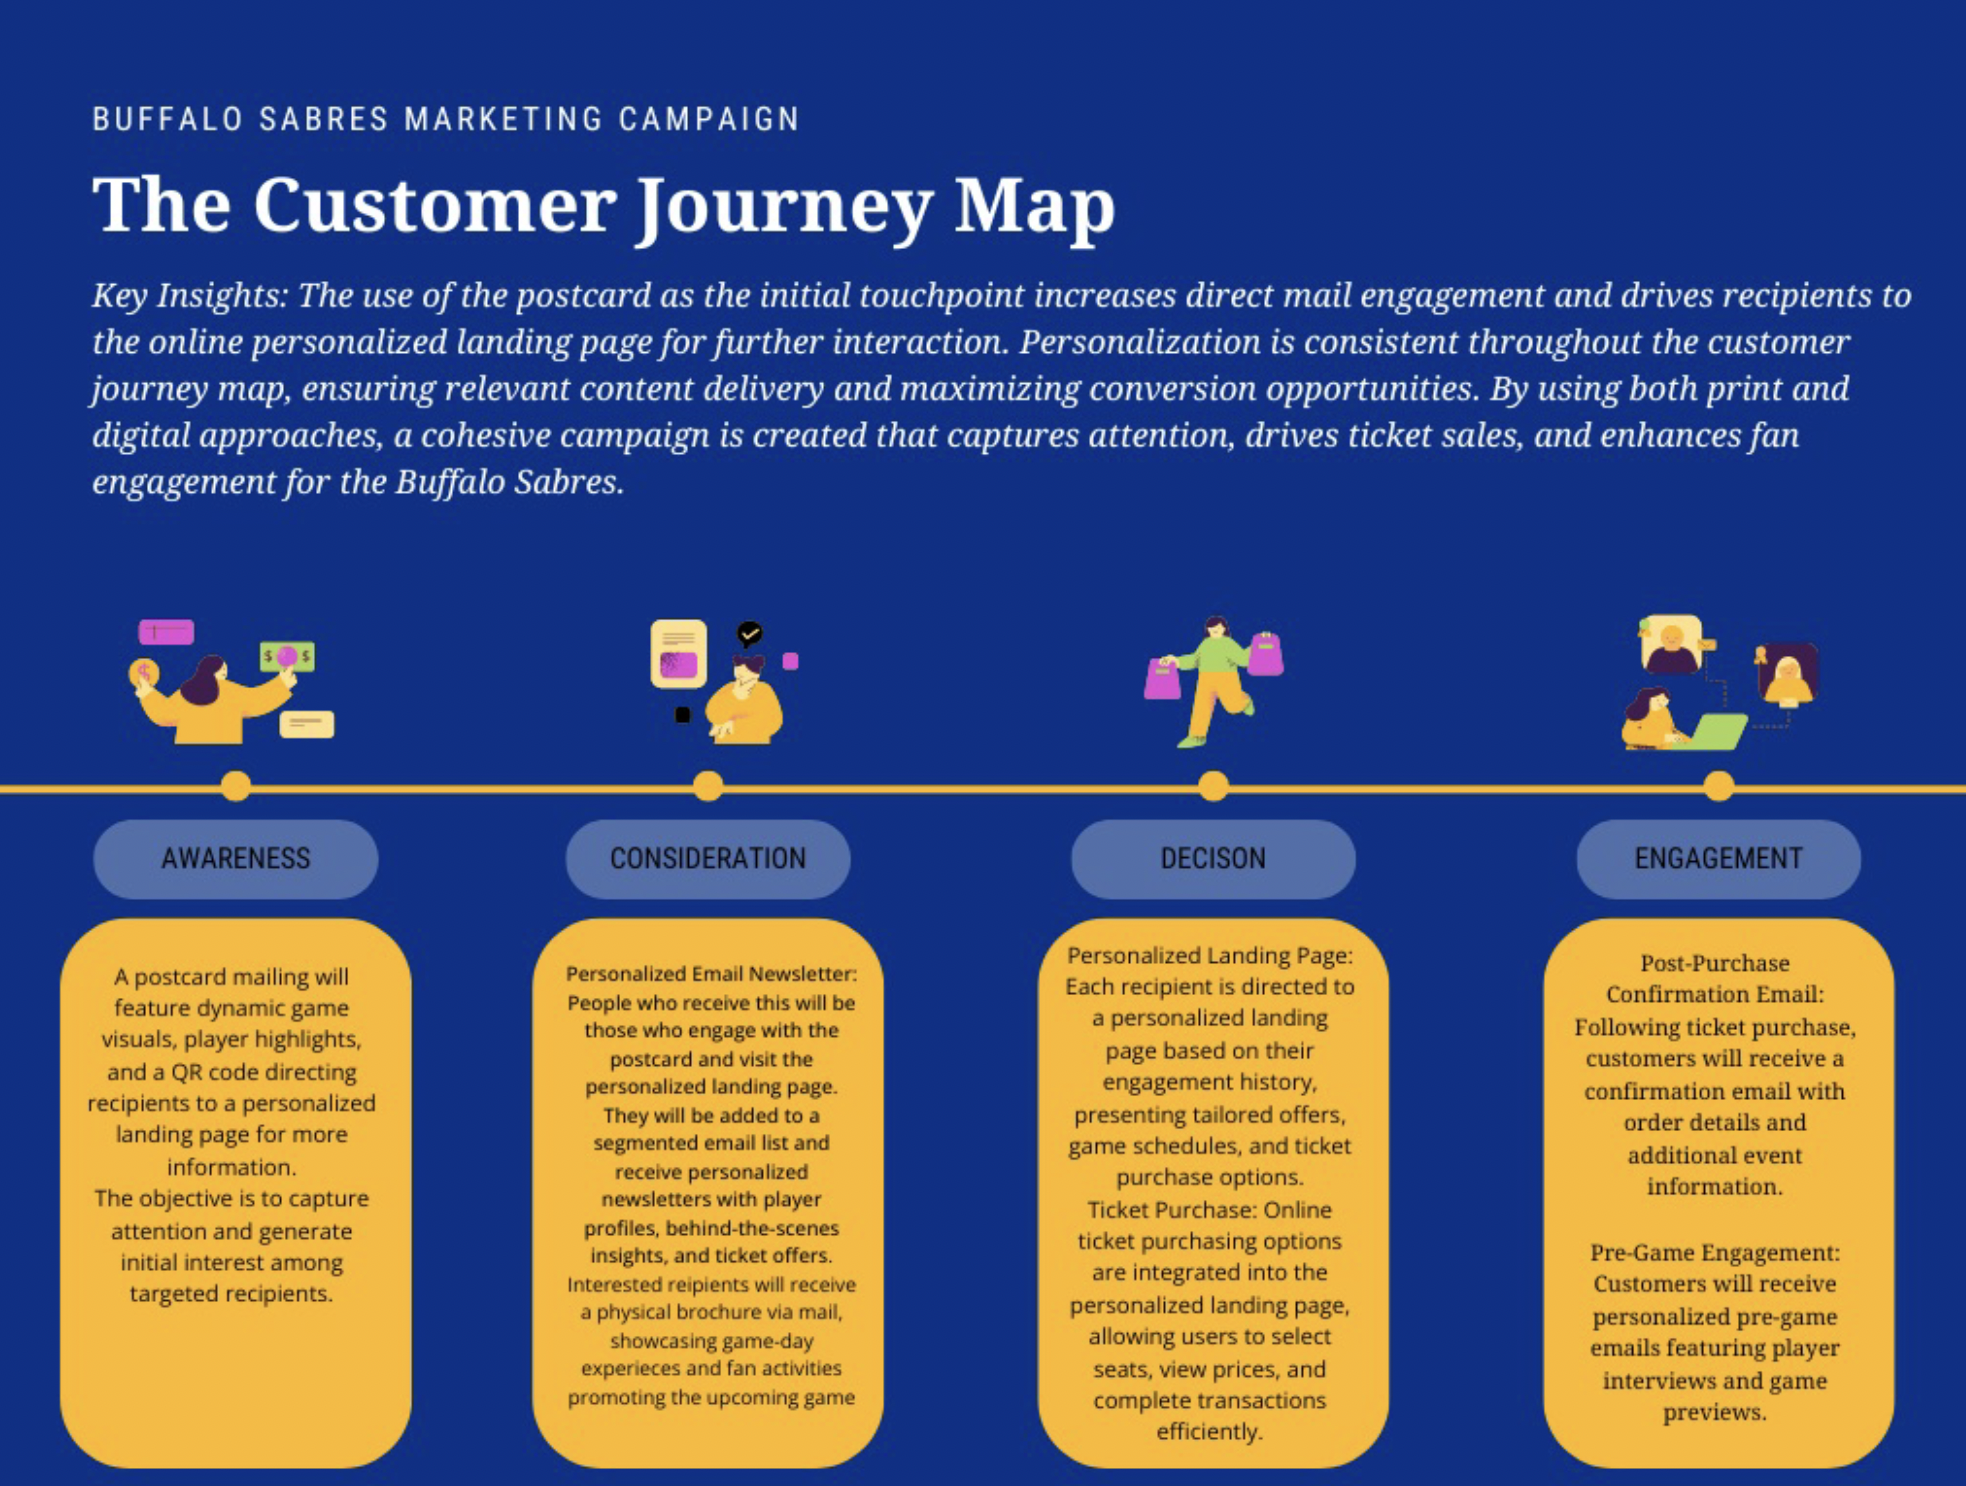
Designed a Customer Journey Map highlighting key touchpoints throughout the customer journey, starting from the awareness stage.
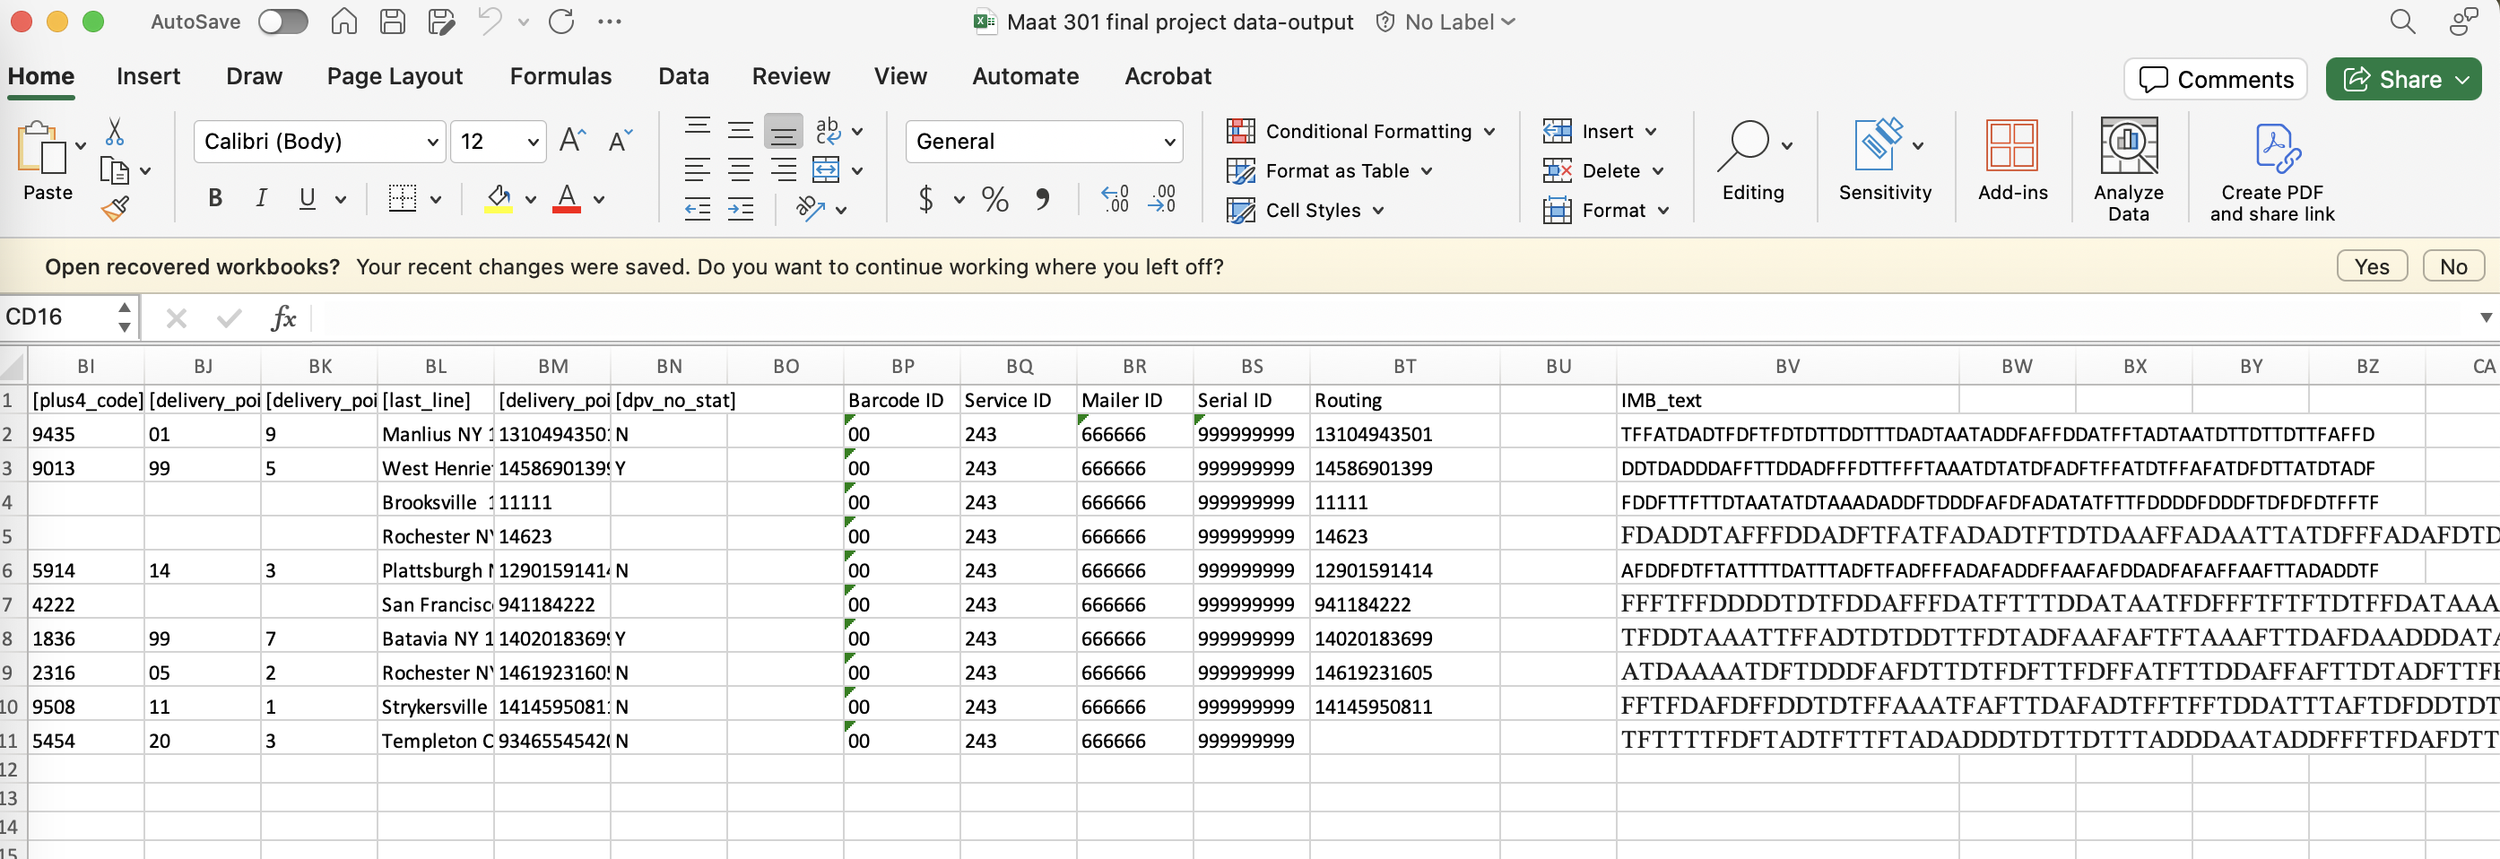
Utilized Hubspot to build and execute the marketing campaign, including the creation of prospect lists, validation of mailing lists, and integration of IMB mailing automation.
Implemented data collection strategies through Hubspot forms, driving traffic to capture additional information needed for segmentation and personalization.
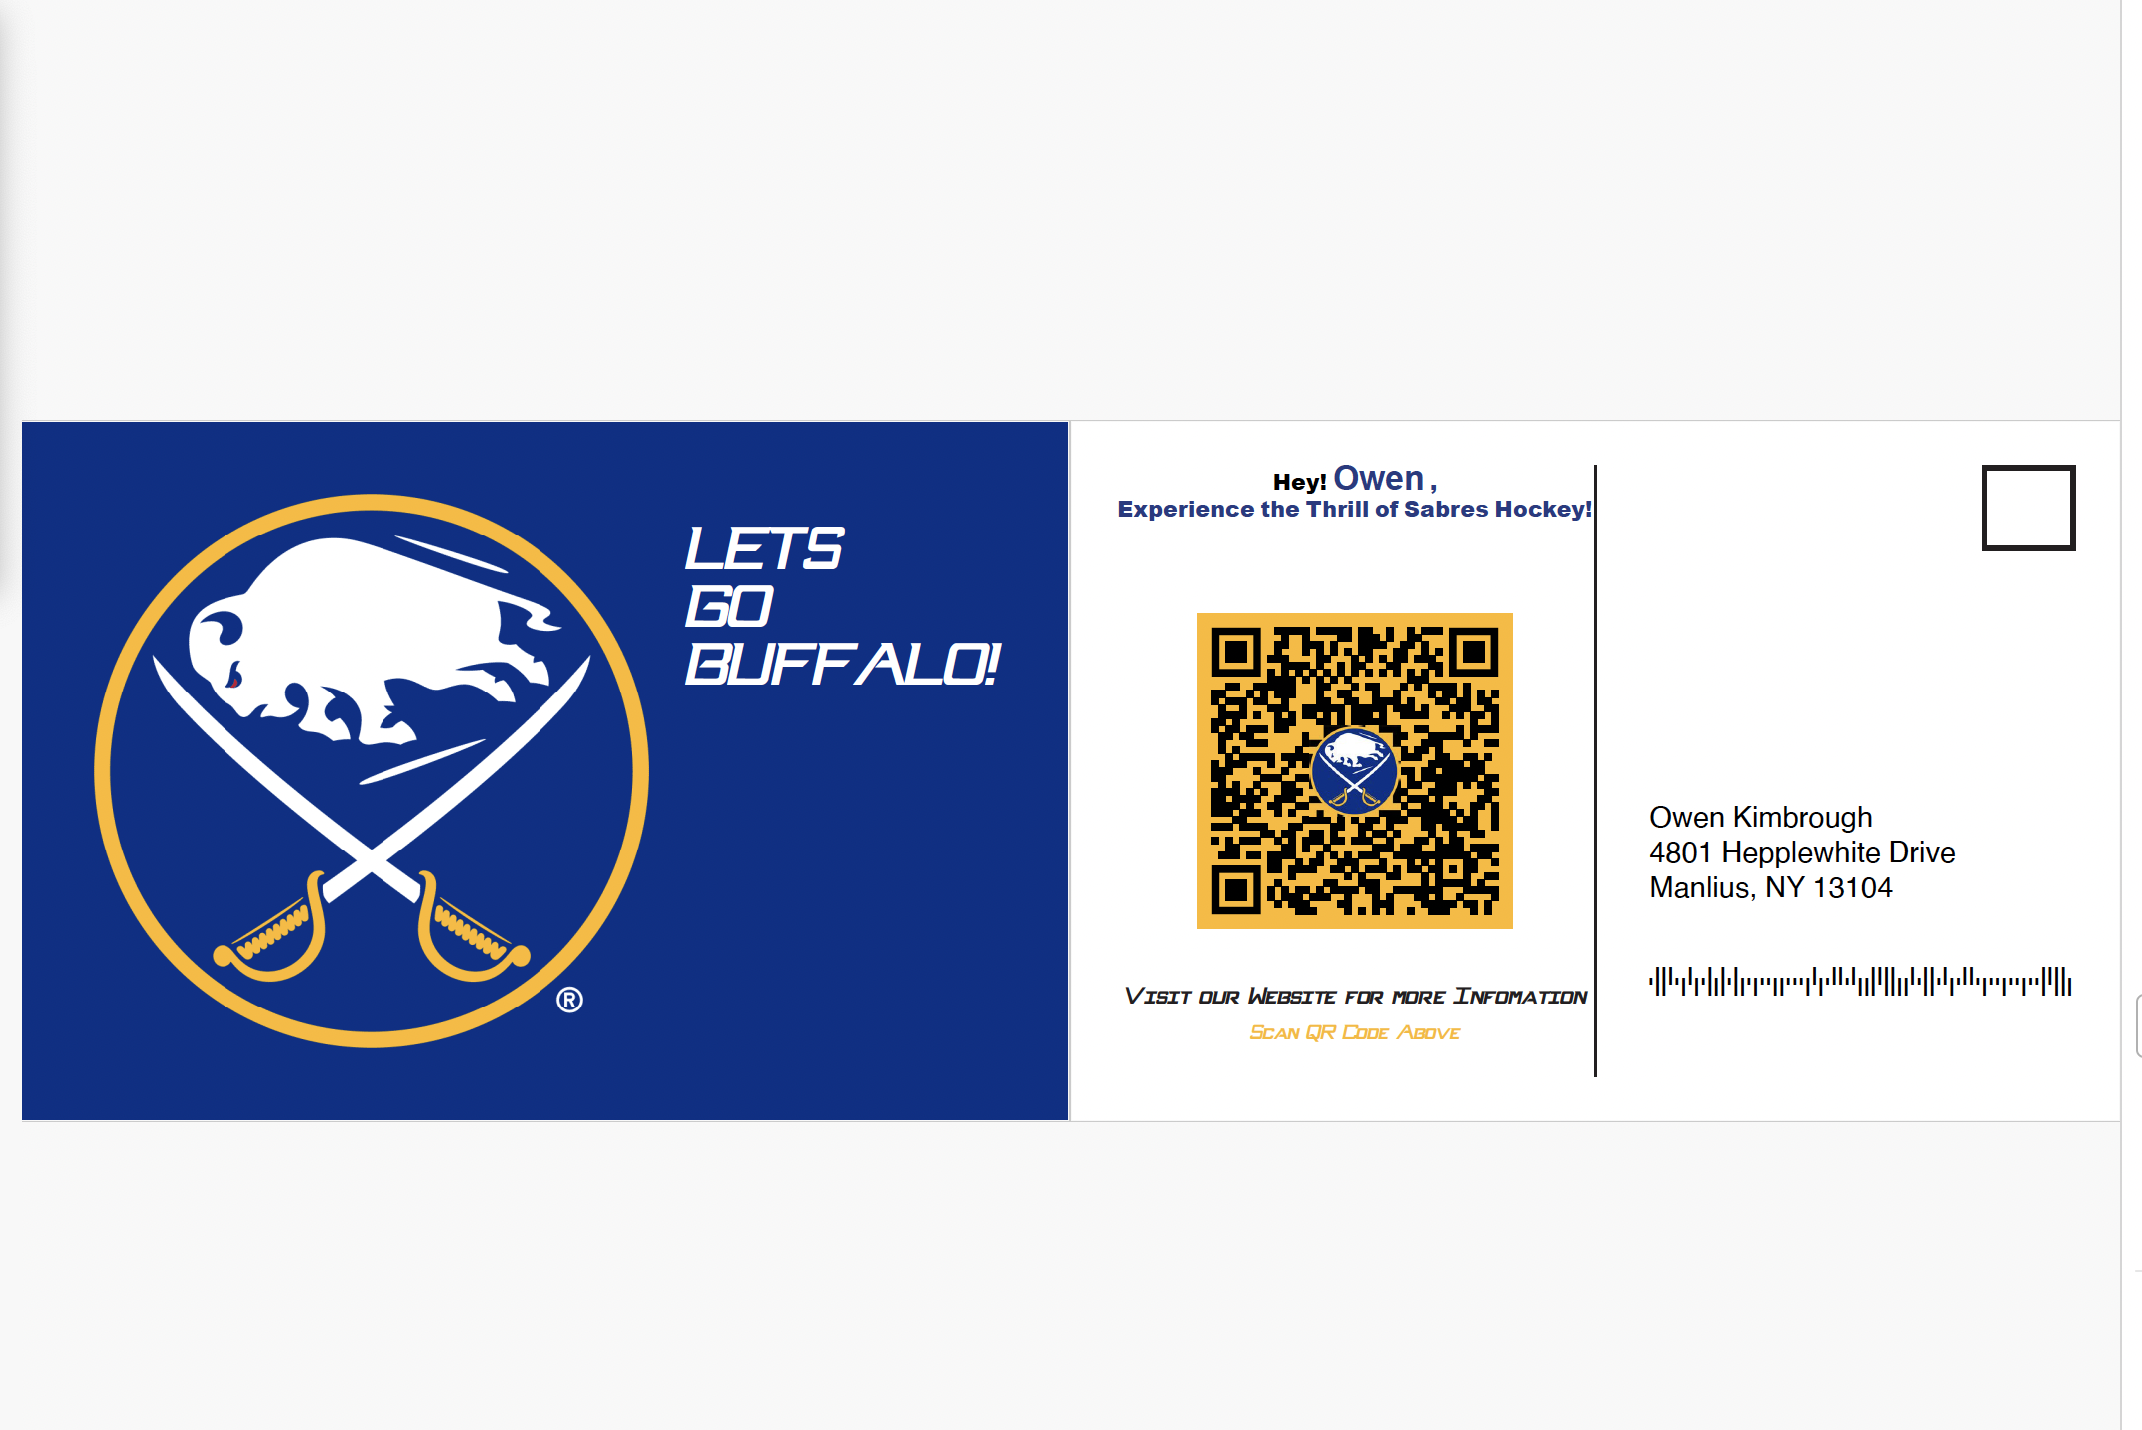
Generated UTM codes to track traffic sources and integrated them into URLs/QR codes for enhanced analytics.
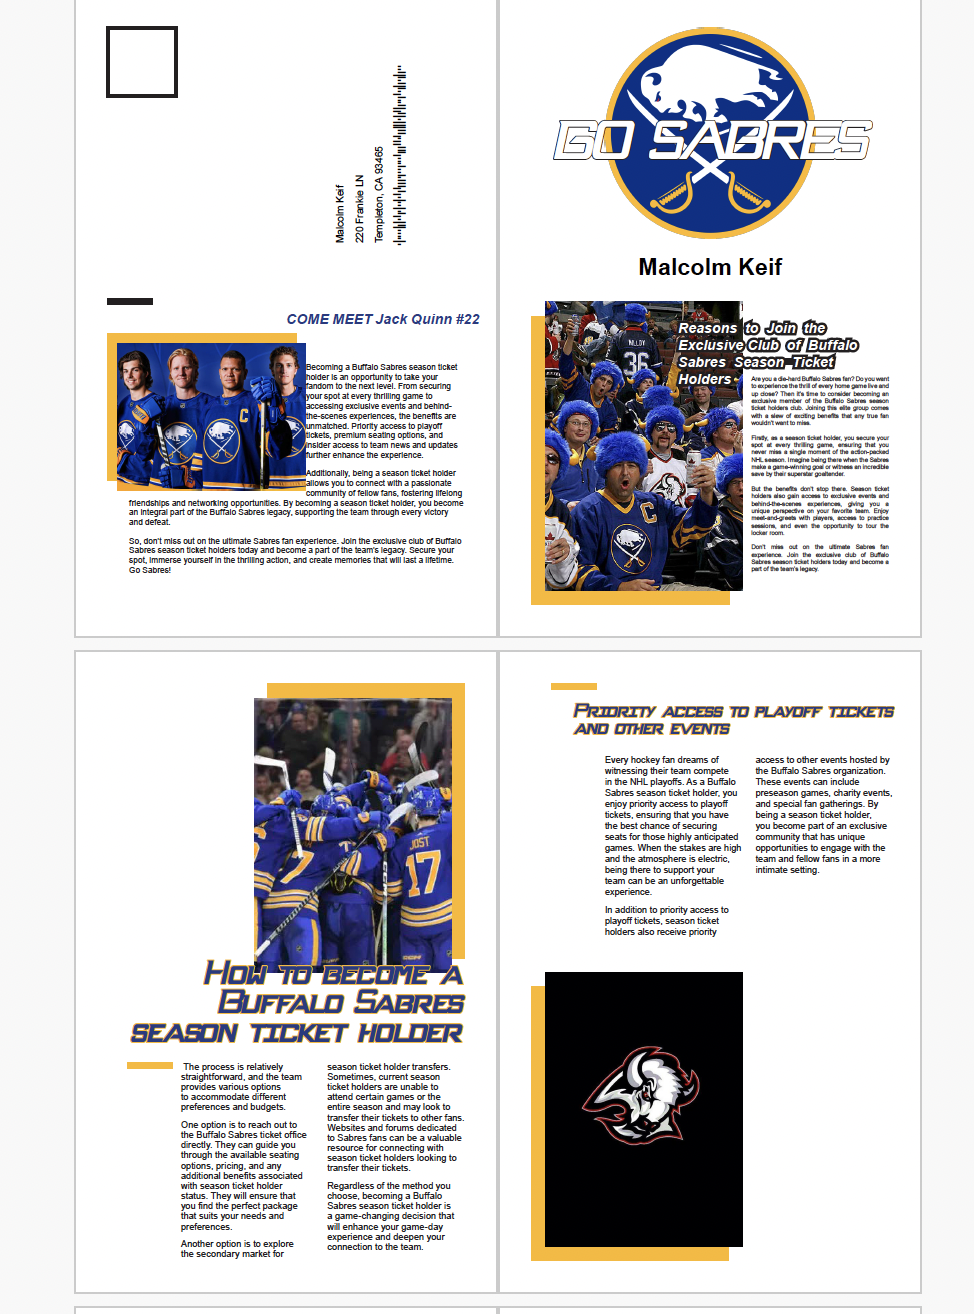
Developed VDP (Variable Data Printing) printed pieces using FusionPro in Adobe InDesign, including postcards and customized brochures tailored to individual personas.
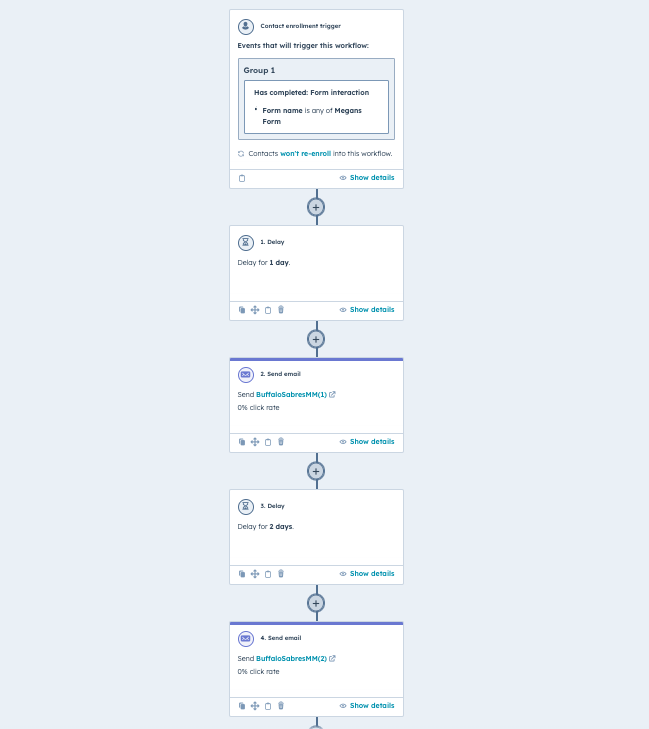
Designed PURL (Personalized URL) landing pages in Hubspot and triggered workflows with automated email sequences to engage prospects at various stages of the customer journey.
Ensured a unified graphic media and type assets with a professional design aesthetic, maintaining consistency across all campaign components.
Prepared a PowerPoint presentation for a formal sales pitch, presenting the campaign strategy and deliverables.
